


Low fruitfulness and poor fruit set...why choose just one?
As the tallies are coming in this harvest, one thing across the board seems to be clear: there just isn’t very much fruit out there. Our own management company, which operates predominantly in West Sonoma, is clocking in around 50% normal yield. While that number is a little extreme compared to other areas, low yield seems to be a common refrain up and down the state.
How do we get to final yield?
In order to get to the bottom of this, I want to break up yield formation into three chapters: fruitfulness, fruit set, and sizing. Let’s work backwards in time:
Sizing: Beginning with berry sizing, sometimes you get through fruit set only to have berries put on minimal weight. Excessive water stress, heat events or periods of high evaporative demand (VPD, vapor pressure deficit) can reduce vascular water potential needed for berry growth and/or increase berry water loss from sizing fruit during the period from fruit set to lag phase. This is the most sensitive period for berry growth and hence for poor fruit sizing when conditions aren’t favorable. After veraison, these conditions can shut down or reduce sugar loading and lead to smaller berries, though the effect on final berry size is less pronounced than during initial berry growth.
Fruit set: Backing up a developmental step, prior to berry growth, poor fruit set or shatter is of course a regular occurrence these days, especially with budbreak occurring earlier and earlier in recent years. This year, shatter was prevalent in California due to a remarkably early budbreak and a chilly April and May.
The problem with 2026 wasn’t only poor fruit set, but rather poor fruitfulness to a larger degree.
Fruitfulness: Taking another step back in time, fruitfulness is basically what you start with. At flowering the year prior to any given season, future buds are already differentiating into cluster primordia, although the extent of differentiation is still debated. If you are concerned about fruitfulness for the coming year, as soon as canes are lignified you can send your buds in to be dissected and quantified for number of clusters and general size. Excessive shading or stress during bloom in year one can limit your fruitfulness in year two. I believe that the low yield we saw in 2022 was due to drought conditions in the Spring of 2021, although once everything fried on the vines that September, no one cared to quantify the total loss resulting from low fruitfulness.
The number of flowers on each cluster, however, is determined during the current season’s spring during budbreak and period of rapid shoot growth. This is where we first started to notice that something was skimpy about 2026. Bloom was popping, but with very few flowers per cluster.
Weirdly warm weather
Backing up a little, I’ve been following temperature data closely this year mostly to try to make sense of why budbreak was two-plus weeks earlier than usual this year. Typical explanations seem to fail me. 2024 had very warm soil temperatures and a fairly early budbreak. 2026 was still earlier. I’d always heard that warm soil temperatures kicked off an early budbreak but across the board, I’m not seeing anything distinctive about this year’s soil temps. 2020 and 2021 also had warm soil temperatures, but these were also drought years evidenced by their volatility (water conducts heat better than air). I would think that you need both warmth and heat, however nothing about this data seems to be a slam dunk.
Average air temperature also didn’t seem to bring about anything noticeable about 2026, as evidenced by this mess of a graph below. Although this big spike here post-budbreak caught my attention. And here’s where I think the low fruitfulness came from.
Some Background
The reason being that high heat during budbreak and the period of active shoot growth prior to bloom has been shown to cause reductions in yield. Research out of WSU in 2010 subjected breaking buds to cool, ambient (control), warm, and hot temperatures over the course of three years. For the hot treatment, buds were heated with a continuous-flow of warm air, topping out at 40°C (104°F). The warm treatment was kept halfway between the hot treatment and ambient temperature. Flowers per cluster on the basal cluster were reduced by 28% in the hot treatment and 20% in the warm treatment[i]. The apical cluster was found to be largely the same across treatments, so this behavior seems to affect primarily basal cluster position. This may explain some of the wonky uniformity that characterized 2026.
The warm and hot treatment also caused shoots to grow more rapidly, which is said to limit fruitfulness due to an increased competition for assimilates early in the growing season.[ii] During this period, shoot tips are a much stronger sink than developing inflorescences, so if warm temperatures speed up shoot growth and hence the need for nutrients and carbohydrates at the shoot tip, you may then see fewer flowers at bloom.
In fact, Gibberellic acid, which stimulates shoot elongation and is upregulated during these warmer periods of rapid growth, is applied as an early spray in some table grape varieties in order to thin flower numbers and allow for sparse clusters with heavier berries to form.[iii]
Occam’s razor
And this all tracks with what we saw early this year.
Phenology is all about accumulation. The Winkler growing degree days (GDD) starts at April 1st by definition. This year given that we were already well into bloom by April 1st, I ran the accumulation from January 1st to track how heat units accumulated during the winter. The results are staggering.
Since I don’t have great data about exact timing of budbreak across all the sites I work with, I broke this accumulation out by months. Almost all sites showed 50% to 100% more heat accumulation in February leading to an early budbreak. Then March saw 300% more heat accumulation than any other year since 2020. This second warm spell is what caused rapid shoot growth and limitations to flower development from the start. Here are some sites in the North Coast:
And here are some sites from Napa:
And Paso Robles:
Oddly enough, places very close to the ocean saw markedly higher heat accumulation this winter, which is odd as coastal regions are usually more buffered than inland areas. Edna Valley for instance shows the starkest increase of all the locations I polled for this post. Morro Bay, although not a wine region per se, saw double the amount of heat accumulation in each month from January to July. Temperatures at Point Lobos (likewise not a wine region but very coastal) also showed very high heat accumulation during the winter months. I’d be curious to see how this affected Avocado and strawberry growers, which are cultivated along these marine corridors.
Shattering the bed
After a warm February and very warm March, we got a very cold April, with average temperatures barely climbing above 50°F in some locations. You can read more on that here if you’d like. Long story short, if you happened to go into bloom with full inflorescences, you probably didn’t go into May with much of anything. All this makes for small potatoes in 2026.
A warning shot?
This coming winter we are supposed to be experiencing a super El Niño with warming ocean temperatures. Given that we just saw warm coastal temperatures and what they potentially did to this year’s yield, I’m inclined to recommend more generous pruning. Leave more buds to counteract the reduced fruitfulness and poor uniformity. If we’re going to get another hot and vigorous spring, we may see 2026 all over again in 2027.
The above shows temperature from a West Paso Robles vineyard from Jan 2026 to today. Note the warm February and March temperatures and the cool April-May period, which slowed growth significantly at this vineyard as the average temperature didn't exceed 60° for a month. This was the case state-wide. Graph is from AVterra vineyard data portal.
[i] KELLER, M., TARARA, J.M. and MILLS, L.J. (2010), Spring temperatures alter reproductive development in grapevines. Australian Journal of Grape and Wine Research, 16: 445-454.
[ii] Bowen, P. A., & Kliewer, W. M. (1990). Relationships Between the Yield and Vegetative Characteristics of Individual Shoots ofCabernet Sauvignon’Grapevines. Journal of the American Society for Horticultural Science, 115(4), 534-539.
[iii] Dokoozlian, N. K., & Peacock, W. L. (2001). Gibberellic acid applied at bloom reduces fruit set and improves size of’Crimson Seedless’ table grapes. HortScience, 36(4), 706-709.
Data from Western Weather Group and Davis Instruments Weatherlink
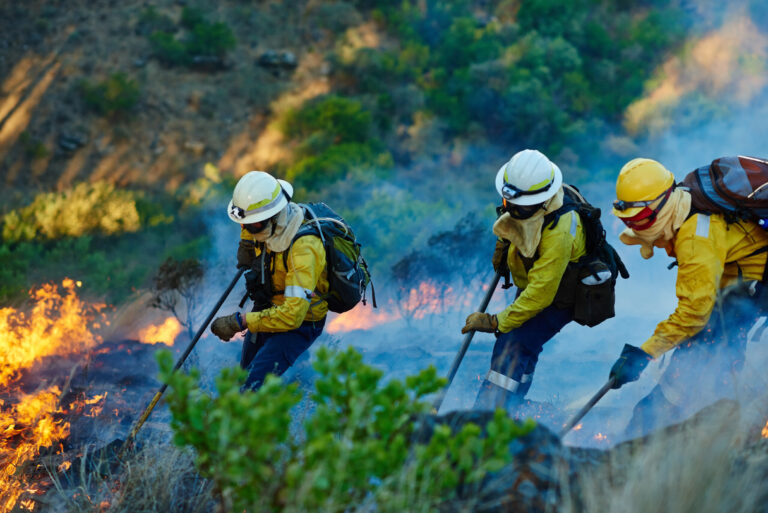
Real-Time Air Quality Sensing for Vineyards
Wildfires are unfortunately something we deal with here in the Western United States. Smoke affects grape quality and the health of our employees. Smoke is not just one thing though. Particulate matter size, duration of exposure, freshness of smoke…all these things affect how your vintage is going to be affected when disaster strikes.
Understanding particle size, smoke duration, concentration, and environmental conditions provides valuable information for evaluating smoke events and making informed management decisions.
Our remote air quality monitoring solution delivers continuous, real-time measurements directly from your vineyard (no matter how remote) allowing you to track changing conditions without relying on nearby public monitoring stations.
Key Features
Solar-powered operation
Remote cellular connectivity (no Wi-Fi required)
Easy installation
Continuous real-time monitoring
Cost-effective deployment
Designed for vineyards and agricultural environments
Measures environmental conditions associated with wildfire smoke
Measures multiple components of AQ
PM0.3, PM1.0, PM2.5, and PM10
Volatile Organic Compounds (VOC) – NEW!
Carbon Dioxide (CO₂)
Nitrogen Dioxide (NO₂)
Ozone (O₃)
Temperature
Relative Humidity
Find out more: call us at 415-619-4955 or email info@advancedvit.com
A challenging year demands precision
It is July 17th, and harvest is already underway. 2026 is the earliest vintage in nearly half a century, and that’s presented some unique challenges. As a viticulture consultant specializing in irrigation, I wanted to go under the hood and talk about how we managed this growing season. Specifically, I wanted to illuminate what technologies we used and how we used them to get us here…to harvest…in July.
Get ready for it…soil moisture
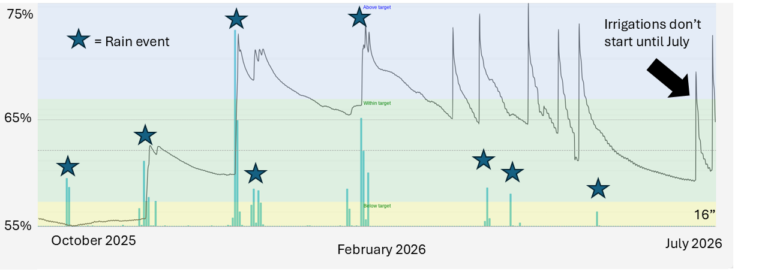
We talk a lot about soil moisture and for good reason. Soil moisture probes let you know how much water is in your soil, where the water is, where roots are active, and how irrigations behave in your soil. If there was one piece of equipment that was imperative this year, soil moisture probes are it. The reason being that this year, in addition to being early, was relatively wet. Even here in the Central Coast we got a solid amount of rainfall with much of it falling in late winter/early spring. Rainfall makes a lot more nutrients available for the vines compared to drip irrigation since rain wets a much larger surface area and, hence, soil volume. The fact that a warm February had budbreak popping off early meant that vines were able to tap into this ample moisture and the nutrients in solution. Canopies started out looking great!
…until they didn’t. Plummeting temperatures in April and May shut put the brakes on shoot growth throughout much of the state. Short shoots? Uneven growth? Stunted tendrils? …During bloom?? I guess I should water, right?
If you had a probe (or were using the one you have but usually ignore), you would see that you were most likely at field capacity and your stunted growth was instead owed to average temps that barely climbed above 60° Fahrenheit (keep in mind that growth essentially stops below 50° (10°C).
Behind door number two: plant stress sensors
Phenolic development is heavily influenced by water stress in lag phase and veraison, when your tannins and anthocyanins are forming. For example, we aim for water potentials around -13 to -15 for Cabernet as a pressure bomb measurement during these periods. For Pinot noir, it’s more like -11 to -13 bars. In a normal year, we have all summer to build stress, hitting maximum stress levels around late July/August. We’re a month early this year. Vines were sliding into lag phase while the profile was still full from all this spring rainfall, compounded by excessive irrigation from panicking growers. Depending on soil type, a lot of vineyards didn’t dry out enough to reach even moderate stress levels.
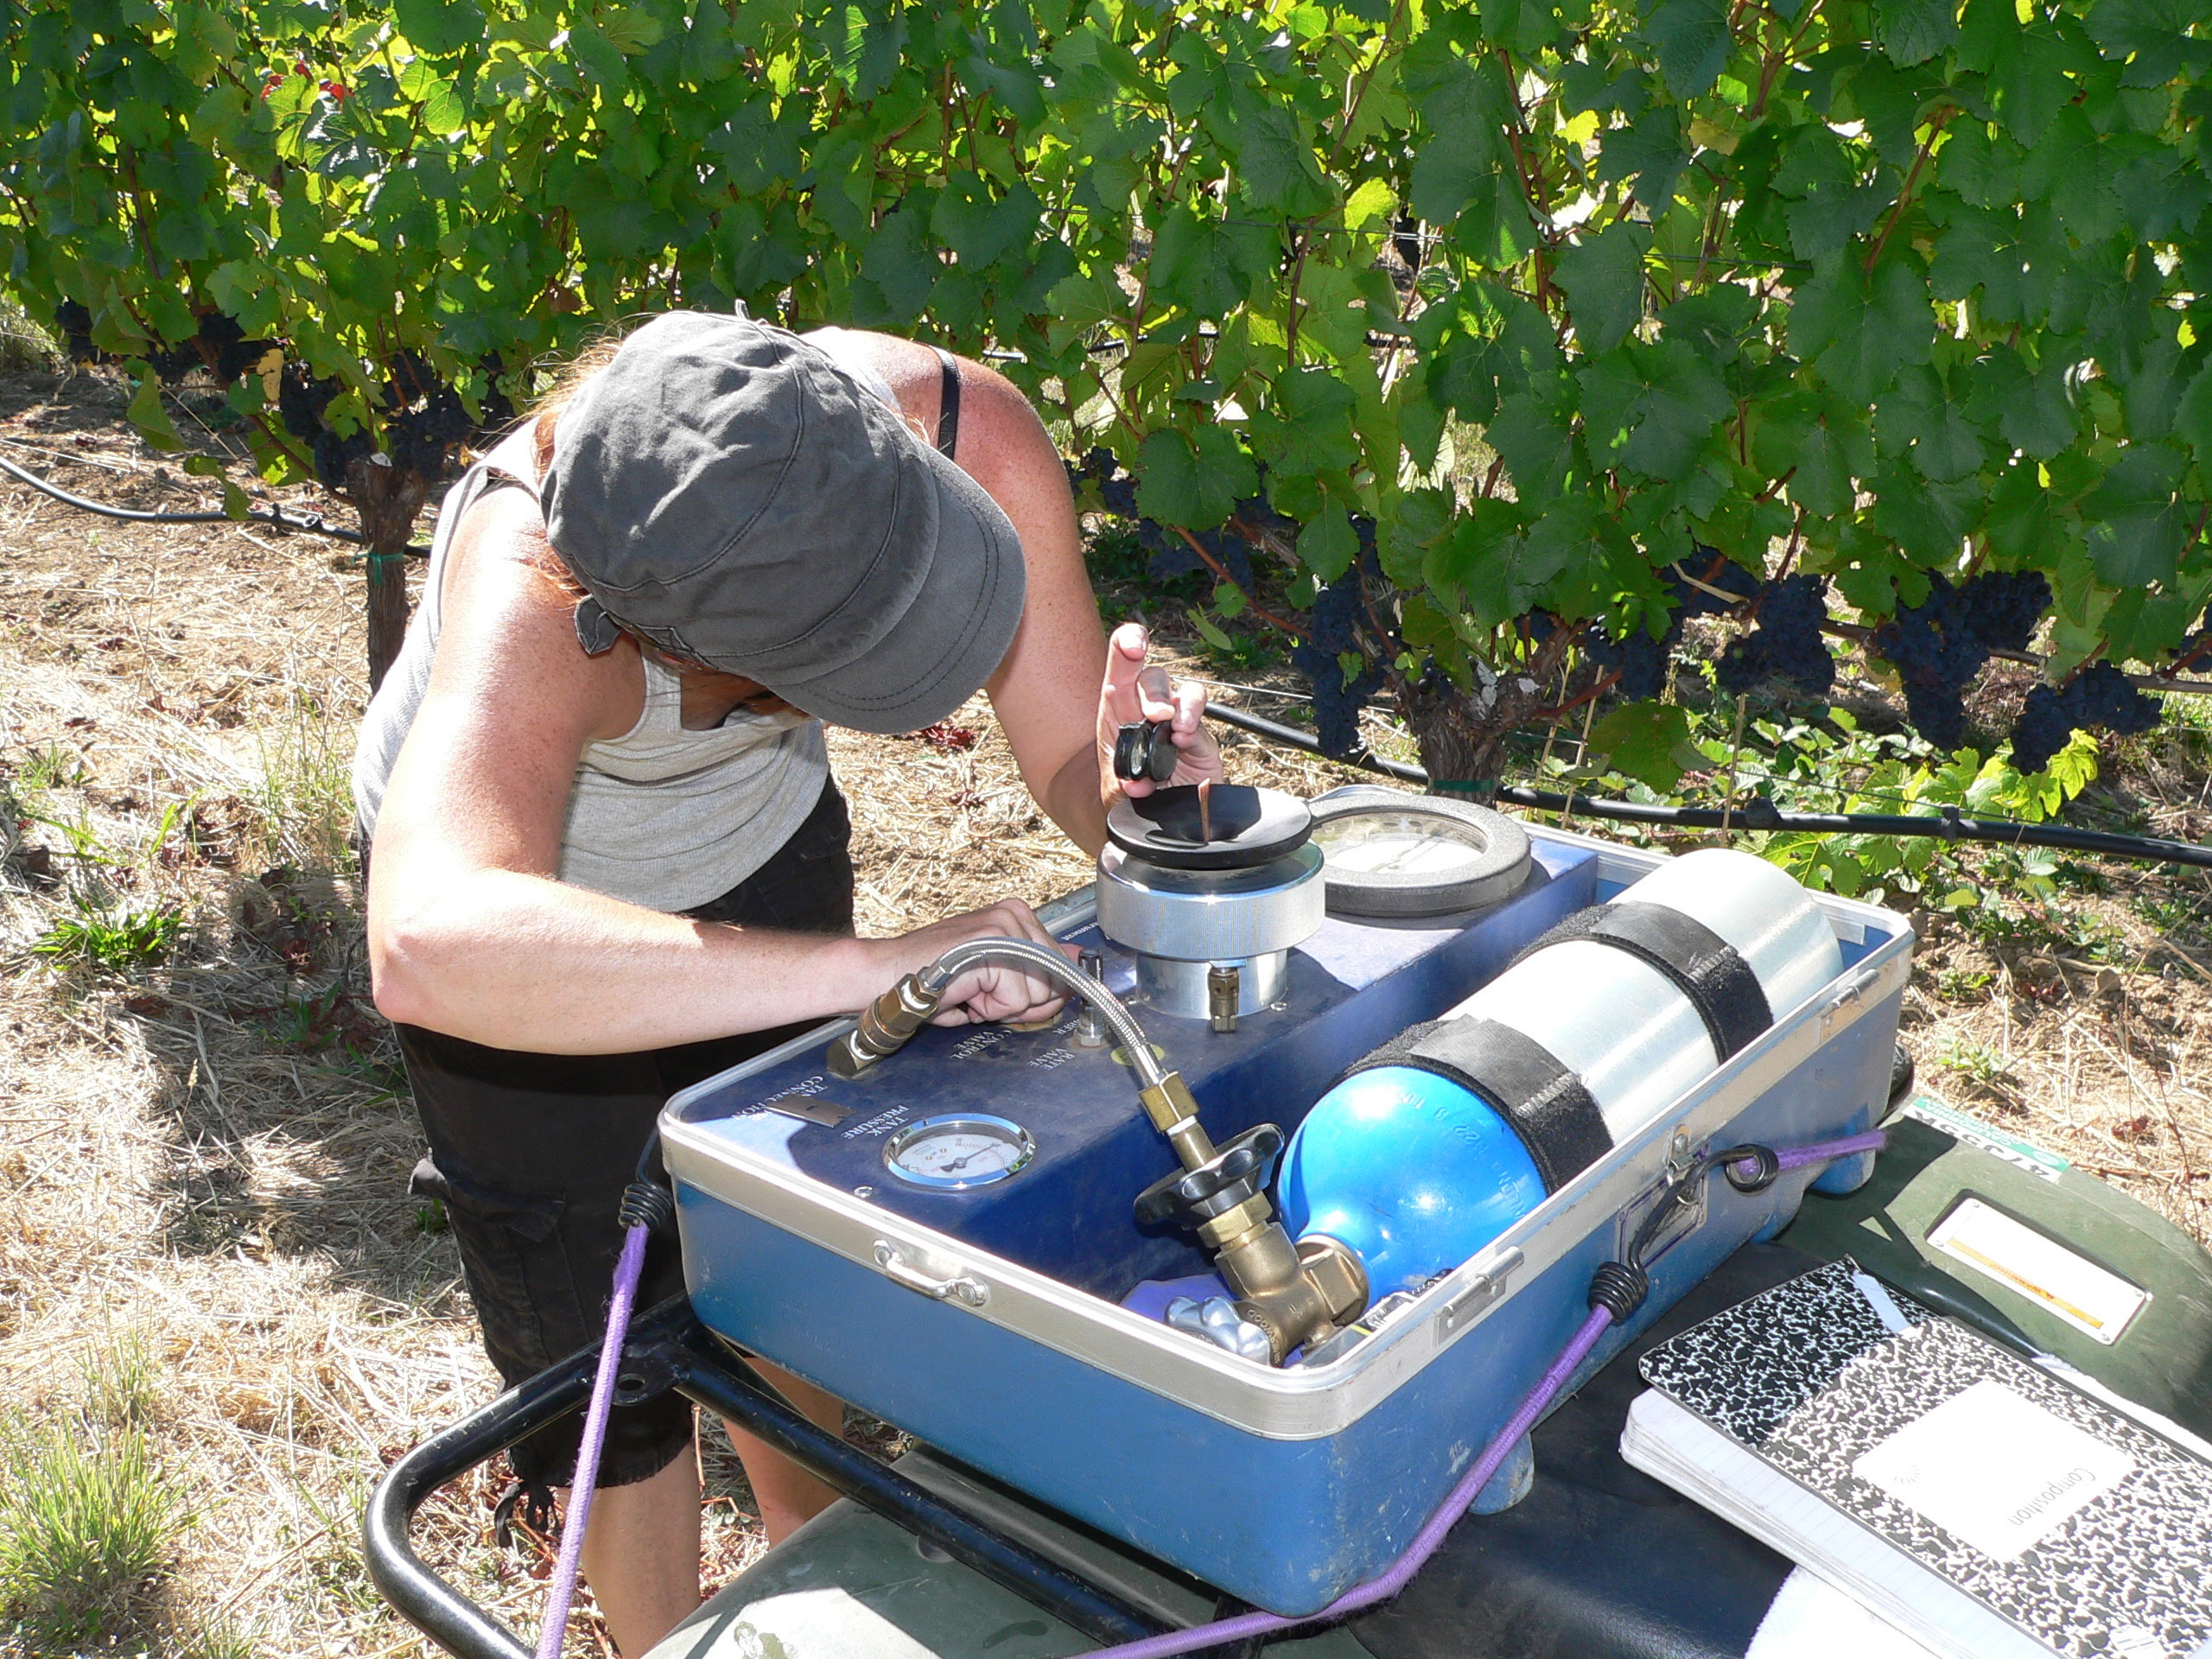
That brings me to plant stress measurements, which is what I really care about after all. There are a number of ways to quantify how stressed your vines are. The most ubiquitous is the pressure bomb that measures leaf water potential i.e. how much tension is in the xylem. Pressure bombs are clunky and only give you as many measurements as you care to take during the hottest part of the day. A few years ago, we switched to using Florapulse microtensiometers, which track water potential every 15 minutes. I can’t explain enough what a game changer these sensors have been and I’m still astounded at how few growers have adopted them, especially for a crop like winegrapes. Knowing how stressed vines are, and historically, how stressed they get at different soil moisture levels, help track exactly how far I can push vines.
And you can push vines too far! Although I find very few growers who actually do. Yellowing basal leaves are a tell-tale sign of a vine that needs water. It would be better to know you’re running out of water before vines start abscising their photosynthetic machinery (and your vines’ built-in shade cloth!). Depending on soil, variety, and rootstock you may not be able to resurrect vines that have already made the physiological decision to close up shop for the season. Soils with poor percolation for instance are notorious for crashing. Vines in these soils have nice deep roots that are extracting moisture from the bottom of the profile. When that runs out, you suddenly find you can’t get water past 16”. The vine needs to have active roots up top to take over when the deeper roots run dry. If you’re waiting for vines to crap out before you turn on the water, you’re going to hit a big speed bump.
In sum
As an irrigation specialist, these tools allowed me to be aggressive…very aggressive…especially in places where I know phenolic development is top priority for the winemaker. Every drop of irrigation water that wasn’t needed set us back a week from our target stress levels and this year, a couple weeks is all we had to build a whole season’s worth of stress.
You can spend a ton of money on technology right now if you want, but soil moisture probes and plant stress monitors are relatively inexpensive. Maybe you have some probes installed and you just don’t know how to use them. Here at Advanced Viticulture, we make technology work for you so you can make the best decisions.
Looking to get more from your vineyard technology?
Advanced Viticulture works with growers throughout California to interpret soil moisture, plant stress, weather, and irrigation data. Through our AVterra platform, we also integrate sensors into one dashboard and deliver practical irrigation guidance.
What does that mean for the vintage?
Budbreak came early to California this year, which by itself isn’t that strange. There are years when we’ve seen buds start to push by the end of February. But then what started as a warm February gave way to abnormally warm temperatures in March and early April. This accelerated phenological development even more. Traditionally, April 1st is the day when the count starts for growing degree days accumulation. But this year vines in many parts of the state already had more than a foot of growth by then, rendering this yearly measurement fairly useless as a comparison tool. By May 1st, I noticed bunch closure in a Central Coast vineyard…which in the words of the great Stephen Colbert, is just booboo banana bonkers.
So what does a crazy early start mean for the vintage? What can we expect and why am I …cautiously optimistic?
Water water everywhere…
In truth, the growing season for grapes starts well before any buds push at all. I’m talking about winter rainfall, or more importantly, late winter/early spring rainfall. In wet climates, this sets the stage for early growth but more importantly, the vines’ ability to reach water stress targets as we get into lag phase and veraison later down the road. Very wet years in the north coast on heavy soils with high water-holding capacity, don’t often dry out in time to get anything lower than a -6 on a pressure bomb. For varieties like Cabernet Sauvignon, you’re aiming for something closer to -13 by the time veraison hits. This year, the north coast got some high rainfall throughout the winter and into early spring. I therefore expect that some vineyards may never reach those target stress zones, especially if veraison hits a month sooner than expected.
Where I am in Paso Robles, rainfall is usually a small fraction of what the North Coast gets. We actually got upwards of 23 inches with a whopping 5 inches of it falling in mid-February. That’s a lot when you consider that this area is lucky to get 6 inches all year. And it shows! Central coast canopies that are normally skimpy and weak, depending solely on winter drip-irrigation in this part of the state look full. Rain always wets a much larger surface area (and hence soil volume) than do drip emitters, so both the hydric state and the nutritional state of these vineyards markedly improves in years that are wet, especially if canopy development is early enough to take advantage of it before the cover crop and gravity gobble it up.
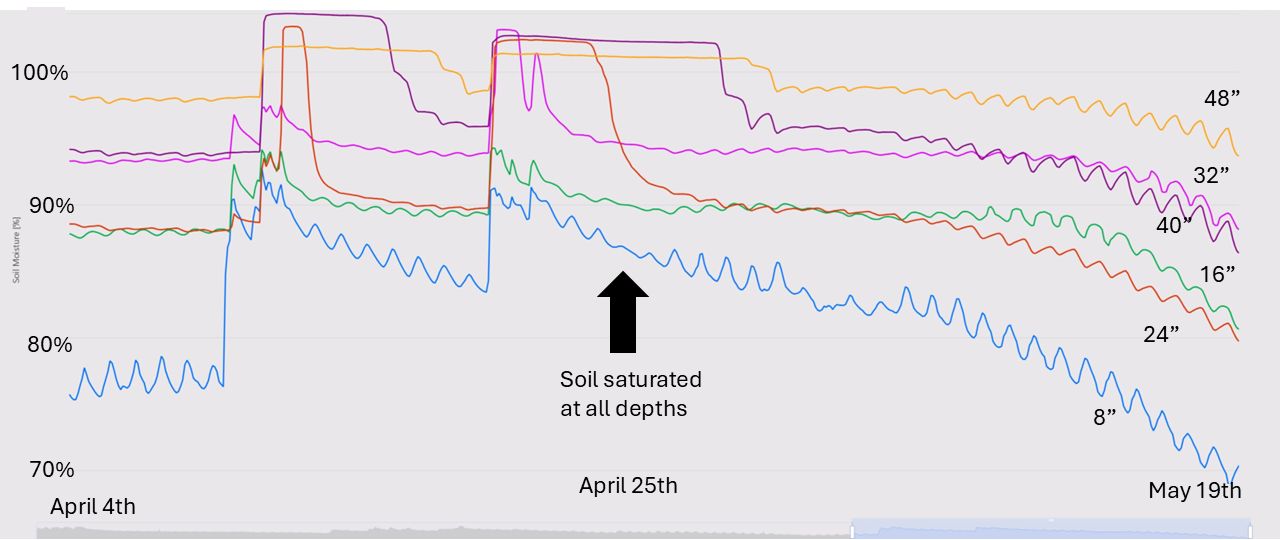
This Sonoma vineyard is on heavy soils. A saturation event in late April means this block may not dry out in time to adequately stress vines for quality.
Winter is coming…again
And then nature reminded us we were still in early spring, with temperatures dropping like a stone just in time for crop insurance…I mean flowering. Poor set, stuck caps and shatter are a common complaint up and down the coast. Unlike 2023, which was cool but late, low temps dipped for a week and if you were unlucky enough to be flowering during that time, you had poor fruit set. This year, primarily due to the precociousness of the season, a lot of fruit didn’t set as cool and wet conditions have stuck around for over a month.
In addition to poor set and shatter, we’re also seeing a lot of low fruitfulness. High temps during budbreak can cause low fruitfulness in buds, mostly due to the competition for assimilates from actively growing vegetation (Keller 2020). Keep in mind though that grape flower primordia form during bloom/fruit set of the prior season. Cool overcast temperatures during that period can lead to limited yield potential because primordia tend to form tendrils instead of clusters. Looking back on last year in late May and June, it doesn’t look like things dipped too low, at least not in areas where I’m seeing skimpy flowering this year. We certainly didn’t get cold enough in California for any winter-induced bud death. So maybe this year’s low fruitfulness can be attributed to a hot budbreak? Who knows? Some things don’t always make sense. Don’t look at me.
Anyway, poor fruit set and fruitfulness might be a benefit to growers overall as, we hope, wineries come out of hiding looking for fruit. (call us if you’re looking!)
The most obvious effect of the temperature drop off we’ve seen this spring is stagnating vegetative growth. Grape metabolism is optimal around 75-85° (25-30°C), so a sudden drop off in temperature means a reduction in photosynthesis and also reduced nutrient uptake, which is manifesting as short uneven shoots and apparent deficiencies in nitrogen and potassium. This is paradoxical since ample rainfall makes more of these nutrients available (Keller 2020). Apical tendrils are short and stunted, leading many to believe vines are water-stressed when in reality the soil is saturated at deeper depths or at least very moist and the vegetative growth just isn’t active enough to be tapping into it. Again, these weren’t a few cold days here and there. April was downright cold and wet. In high elevation coastal vineyards we saw weeks of temperatures where the high didn’t reach over 60° Fahrenheit. Growing Degree Days don’t accumulate if the average temperature is below 50° (10°C) meaning vine metabolism essentially stops. If your weather is normally variable, it’s abnormally super variable this year.
The above shows temperature from a West Paso Robles vineyard from Jan 2026 to today. Note the warm February and March temperatures and the cool April-May period, which slowed growth significantly at this vineyard as the average temperature didn't exceed 60° for a month. This was the case state-wide.
What awaits us?
Provided you can get through the spring with some crop left on the vine, an early season can be a favorable one. Places that usually get hit with high heat will be able to get through fruit set and into veraison before the typical mid and late summer heat waves hit. Post-veraison fruit is less susceptible to heat damage as well as smoke taint from wildfires later in the season due to the accumulation of anthocyanin and epicuticular wax respectively. For cooler vineyards, an early start and presumably fewer grapes means you can actually get your fruit ripe, which wasn’t a given in both 2023 and 2025. Places that struggle with water stress have ample soil moisture to work with and hopefully full reservoirs too.
September and October have been notoriously variable in recent years. Think 2022 with a late heat wave wiped out what was a decent vintage, or 2020 when the Glass fire…y’know what, we don’t need to relive 2020.
The one thing about an early season is that ripening grapes during longer, warmer days is going to further accelerate sugar accumulation. If you struggle to line up your physiological (i.e. sugar) and aromatic/color/mouthfeel ripening curves with phenolic development, this season may through us a curve ball. I mentioned that just getting to the right water-stress levels in time for lag-phase and veraison will be challenging if your soil holds onto water. It’s important to hit some level of water stress, at least in red varieties, prior to veraison in order to stimulate the phenolic ripening process. The other important factors in wine quality such as acid, aromas, and sugar accumulation are usually derailed by heat events exceeding 100° and 105°. The benefit of avoiding these heat events common in August and September outweighs the cost in my opinion.
And for my growers, aside from dwelling on the insane logistics of harvesting a bunch of fruit that’s all ripe at the same time, are y’all excited about having September off this year??
Keller, M. (2020). The science of grapevines. Academic press.
Two years ago, I wrote an article on AI in the vineyard for WBM. Feel free to read that article here…if you want. Otherwise, my basic argument was that although AI will eventually play a role in how we farm grapes, it’s a long way off compared to other industries and even other crops. We who grow grapes are the last ones to see such innovation.
And since then, AI has grown exponentially. If two years ago you were playing around with Chat GPT to create bizarrely distorted images and learn about tax loopholes, you can now go onto the likes of Claude and have it just create a website for you from a single prompt. Chatbots like this have essentially eliminated the need for entry-level coders.
However Claude is a computer, so it makes sense that it’s gotten very good at writing code for other computers. Similarly Chat GPT has digested the entire internet, and curates any answer for you by plucking it from its vast network of information. Sometimes its correct, and other times … less correct.
Vines aren’t computers…that’s right. I went to college.
And that’s where my argument on AI in the vineyard remains unchanged. We need a lot of data to train machine learning models and we don’t have that in viticulture. Now my previous examples are generative AI’s, i.e. bots that build things. But they are a bellwether for the state of technology as a whole, which has also improved considerably. You can’t make up for a lack of information though.
Many other industries, the ones we see significantly altered in recent years, have this plethora of data. Let’s say you want to come up with a model that, for instance, maps the behavior of people in an airport. Any given airport on any given day produces millions of data points tracked via sales information, inventory, flight schedules, etc. If you wanted to target specific groups or even specific individuals most likely to buy a certain product, the footprint we leave constantly informs these models.
But in viticulture, you might have a dirty notebook somewhere or a few random excel files on cluster counts from blocks that were subdivided years ago. Even if we as an industry were better organized, gathering data in vines is hard. Seasons are variable. Blocks are variable. Measurements are time-consuming in a job where timing is everything.
Gathering data in viticulture is an arduous task. So is keeping records of it.
Gathering data for data’s sake
If I’ve seen anything take off since I last wrote on the topic, it’s companies offering to track yield and infrastructure using AI models. The method is simple (but not easy): they put a camera on your tractor and gather data while you go about your normal operations. Then they use machine learning to count clusters in addition to giving you a count of missing vines, virused vines, emitters, and broken posts. A robot that does yield estimate is arguably pretty cool…but at what cost?
When I first heard of this, the ROI seemed fairly straight forward. Yield estimation is super important but notoriously inaccurate. Random sampling in a big block in July and August is hard even for experienced vit techs and samples are often taken and multiplied over inaccurate vine counts that don’t account for missing vines. Having an exact count of clusters alone is something worth paying for and the pricetag I would put on it is, well, probably a little more than what I would pay an intern to do it for me. I am paying for better data afterall. Then, if I want to, I can correlate that data with my actual yield and improve my predictions going forward. That’s worth something but not everything. As one grower I spoke to said, “Yield estimation is a problem, but it’s definitely not the only problem.”
As for the ability to monitor virus spread, I don’t see the advantage of having precise incidence numbers. Most growers don’t rip out individual virused vines, they rip out blocks and if a block is 25% infected, it probably pays to remove rather than farm. Do I care if that number is 27% or 32%? The decision to rip out depends on what the wineries are telling you anyway. If a block shows consistently declining quality and can’t compete in what is a cutthroat market right now, you’re going to pull it out no matter what the virus incidence is.
When it comes to vine counts, I still think a good old flyover similar to what a company like Vine View offers, is adequate enough to understand how many vines are missing. Unless you are an enormous company, having those precise numbers from an on-ground camera scan isn’t going be worth what they’re charging, at least not yet. Besides, when you put an order in for replants, you do so a year in advance. Growers are already adding in a fudge factor to their orders should anything die or weaken over the course of the season.
I think that AI used in this way is a cure in search of a disease, akin to how many people wanted to work with drones when they became affordable a decade ago. It turns out driving out to a vineyard to launch a drone is way more expensive than a fixed-wing plan flying out of an airport in Sacramento. A plane can capture thousands of acres in a single flight and isn’t limited by roads or battery life. The most I’ve seen come out of drone technology are pretty videos for the tasting room and website.
Vine View offers services such as vine counts and virus detection for much less than camera-based data collection companies.
Gathering the right data
As a viticulturist, I’m much more interested in informing the decisions you actually make in the vineyard. I think AI can eventually help growers do that in the near term. But it needs to be based on the right data, not just data in general. That’s why I recommend investing in sensor technology first.
One of the biggest problems facing growers in California is water. Having a grasp of how much water you use is vital. Companies such as Lumo allow you to monitor how much water goes into each block. This alone can help you track pressure discrepancies and leaks. It gives you information you can use. If Lumo’s out of reach for you, I would recommend adding a datalogger to your flowmeter because let’s be honest, no one is ever going to check the meter, jot it down, and put it in the speadsheet. Similarly adding a pressure transducer to your irrigation line can be done for a few hundred dollars. Knowing that you are experiencing low pressure throughout the duration of the irrigation already lets you know you should water fewer blocks at a time…or that your booster is failing. That’s something I’d rather spend money on than a precise count of bent T-posts.
There is very little that is truly “new” that comes out in Agtech, except for those rare times when it does. I’m still surprised by how under-the-radar Florapulse micro-tensiometer plant stress sensors are especially since the alternative is a pressure bomb…which sucks. We’ve been using these sensors for four years now in lieu of taking manual measurements of leaf water potential. Having a reading every 15 minutes as opposed to once every week has been a gamechanger. I can track how a vine responds to weather, how sensitive vines are to irrigations, and exactly when we reach desired stress levels at any given point in the season. One thing we can do here at AV is loop together your plant stress levels and your lab data to track what practices and seasonal conditions have historically produced the best wine. That could be used to build models eventually, but even just seeing the information graphed together allows growers to see similarities with their own eyes and make decisions accordingly.
When I first wrote about this in 2024 Li-Cor had just released their Li-710, a scaled down version of their research-grade Eddy Covariance system. While many companies claim to offer a “real” measurement of evapotranspiration(ET) or crop water use, these are all estimated in some way or another. The Li-Cor 710 actually measures your ET by measuring water vapor flux directly. Mark Greenspan has been working diligently with this sensor over the last two years and has created an exact water balance model that allows you to water back exactly what your vines are using. In the end, machine learning can’t make up for experience…so many years of experience right, Mark? He’s also found that the crop coefficient we’ve been using for grapevines (and probably other crop coefficients as well) is exaggerated almost by a factor of two.
Over the last two years, Mark Greenspan has engineered an exact water balance model based on the Licor-710, the only tool capable of measuring actual ET for under $50k. No AI, just experience and collecting usable data about crop water use.
Read the rest of the article here to find out more.
How should I be irrigating?
Water is scarce and labor is expensive. Installing a soil moisture probe can show you when to irrigate, how much to water, and how often. Know where your water is and how long it stays in the rootzone.
Soil moisture probes can be integrated with any existing telemetry device or we at AV can provide inexpensive dataloggers for you.
Reach out anytime to loni@advancedvit.com for more information.
Aquacheck soil moisture probes measure soil moisture at 8" intervals down to 48". Know where roots are actively taking up water and time your irrigations to perfection.
Harvest has wrapped. It's raining. And the only thing on your calendar is that pesky meeting to finalize your budget for next year. Here are some things Advanced Viticulture can help you out with:
- Soil moisture probes: see how deeply irrigations percolate and how quickly water gets depleted.
- Florapulse plant stress sensors: track water stress and maximize wine quality, sans pressure bomb.
- Weather stations: don't just talk about your terroir, quantify it
- Frost monitoring: monitor temperatures and set alerts for dangerous frost events.
- Valve automation: stop sending someone to that far-flung vineyard just to turn a valve.
- Flow/pressure monitoring: Keep track of your irrigation efficiency and see just how much water you're actually using.
- Tank/reservoir/well depth monitoring: how much water are you working with? Know what's available to you whenever and wherever.
Did your fruit get rejected this year? How about leveling up your game with Advanced Viticulture Consulting. The market is competitive. We can help you improve grape quality and save resources...like money.
Reach out to loni@advancedvit.com for more information.
Want your own 2025 year in review?
If you liked out last article on the 2025 vintage, why not have us run the same analysis on your vineyard(s)? Let the folks at AV illustrate just how your vineyard compares to different sites and/or regions across the years.
Show those winemakers why your grapes are worth paying top dollar for. Get in touch with loni@advancedvit.com for more information.
Come see us at WIN Expo 2025!

Introducing Avterra, AV’s vineyard technology hub and irrigation guidance system. Avterra is an integrated data portal that links a multitude of sensor and telemetry providers into one cohesive dashboard.
Based in advanced crop science, our guidance system is thoroughly nerdy yet is easy to use. Our goal is to make vineyard technology uncomplicated so it can best support your decisions as a grower.
Integrating our data streams into a single portal makes interpretation easier and decisions straightforward and repeatable. Dashboards can be fully customized to suit the customer's needs. Create a personalized user interface for your team. Streamline field notes, lab results, and sensor data to view trends as they unfold.
Not merely a collection of charts and tables, Avterra includes data interpretations and recommendations. Remove the guesswork by embedding Advanced Viticulture's decades of experience. We make sense out of those squiggly lines.
How do we optimize irrigation you ask?
Avterra uses Real ET (evapotranspiration) combined with soil moisture, vine water stress, and weather forecasts to determine the optimum irrigation application rates and timing.
Turn data into decisions with Avterra.
To learn more, visit AV at WIN Expo booth 431 on December 4 at the Sonoma County Fairgrounds.
Register for a free trade show floor pass with promo code: ADV431
Hear me out
Up and down the California Coast, we got some rain last week. Up North, places got around 1.3” with up to 2” closer to the ocean. Down south in Paso Robles, we’re looking similar numbers of between 1.5” and 2”. So, one would naturally think that if we were irrigating post-harvest (as we highly recommend), we can stop now. As you may have suspected by the title of this article, that may or may not be the case.
Profile Picture
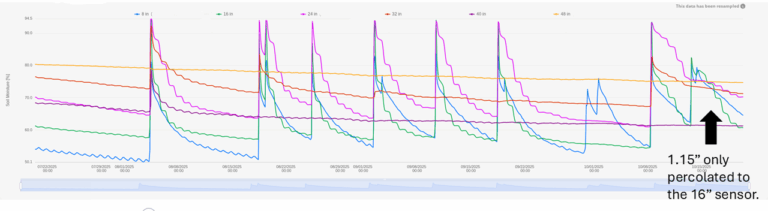
Here at AV, we love looking at soil moisture charts. However, in the case of rainfall, it can be misleading. Looking at the graph below, you can see that irrigations produce a clear spike indicating how deeply water percolated and how long it took to be completely depleted by plant roots. Rain doesn’t deliver the same concentrated volume you’re used to getting with a drip emitter. Therefore it doesn’t infiltrate the soil in the same way. You may see shallower percolation from the inch plus of rain we got, but that doesn’t mean the rain was insignificant since it wets a much larger surface area than drip irrigation.
Soil moisture probes do a good job of showing your soil’s water holding capacity. That’s what I put more stock in rather than comparing a rain storm to irrigations. In the graph below, we see that the average soil moisture (average of moisture at all sensor depths from 8” to 48”) is slower to deplete when compared to the previous irrigations, where water was rapidly drawn up. This isn’t always the case.
In this graph for however, we see that after the recent rainfall, average soil moisture is right back to where it was prior to the rain. Assuming vines haven’t entered dormancy, this site should continue to be irrigated.
What about plant stress?
We don’t water just for the sake of the soil. We care about what a lack of water does to the vine’s physiology. And right now, we want vines nice and happy…not so happy they start putting out new growth, but that’s hard to do. An unstressed vine has a functioning canopy that can produce sugar. With the fruit gone, that sugar gets stored in the woody permanent parts of the vine and used the following season to grow leaves and shoots. Eventually, the canopy will start earning its keep but before then the canopy relies on these stores from the wood.
Vine stress (water potential) is not just a function of water availability. Its also a function of vapor pressure deficit…and salinity…but that’s another article. Vapor pressure deficit is the discrepancy between how much moisture the air could hold and how much it’s actually holding. When temperatures are hot, the air can hold a lot more water in suspension than when it’s cold. That’s why things are dewy in the morning. Water potential, which is essentially just the tension of water moving through the plant’s body, responds to this atmospheric pull of moisture.
When it rains, VPD is very low because humidity is 100%. Vines aren’t just unstressed because there’s plenty of water available. They’re also unstressed because the atmosphere isn’t pulling water out of their tissues.
Even if a rainstorm fails to deliver much water, vines are unstressed. It doesn’t mean it will stay this way though. Late season heat happens here in California and if you stopped watering completely because you assumed the soil profile is full, think again. If the profile is back to being dry and we get some heat, your vines can easily get stressed again.
Get your macros in, bro
One of the main reasons to keep irrigating is to apply some fertilizer. Harvested fruit removes roughly 3 lbs nitrogen and 11 lbs potassium per ton. Applying an N-P-K fertilizer through the drip post-harvest puts some of these removed nutrients back into the system. Later, cool years like this one make getting in this final application difficult, but if you can squeeze it in, it makes a big difference when it comes to early canopy establishment the following season.
Conclusion
Should you irrigate or not? Ideally, you get yourself some soil moisture probes and find out. Otherwise, my general advice is if you’re on a lighter soil or one with poor percolation, I wouldn’t take the rain as a sign that your work here is done. Keep irrigating regularly until leaf fall is the best way to ensure maximize recovery and set yourself up for success next season.
If this year is defined by a singular emotion, it’s anxiety. That’s nothing new in farming, however I’m talking about anxiety over the abysmal grape market rather than any natural phenomenon. Many of us were so busy scrambling for buyers, we may have forgotten to notice just how great the weather has been. Why wouldn’t we get handed a great year when most of us can’t sell any grapes?
Let’s look at some numbers
My gut feeling was that 2025 was similar to 2023 with a few big differences. 2023 saw some record high rainfall in the winter and early spring throughout California. Even the Paso Robles area got around 21” of rain from July 1st 2022 to July 1st 2023, up from a whopping 6.5” the year prior. That amounted to lots of nice canopy development early in the year and some good yield potential, provided you didn’t get shatter during the chilly springtime. This year however, the Central Coast was back to a measly <7” of rain while the North Coast got upwards of 40”. This made for a more “typical” vintage from the outset with Central Coast growers having to water much earlier in the season than their northern counterparts.
And now let’s look at some graphs
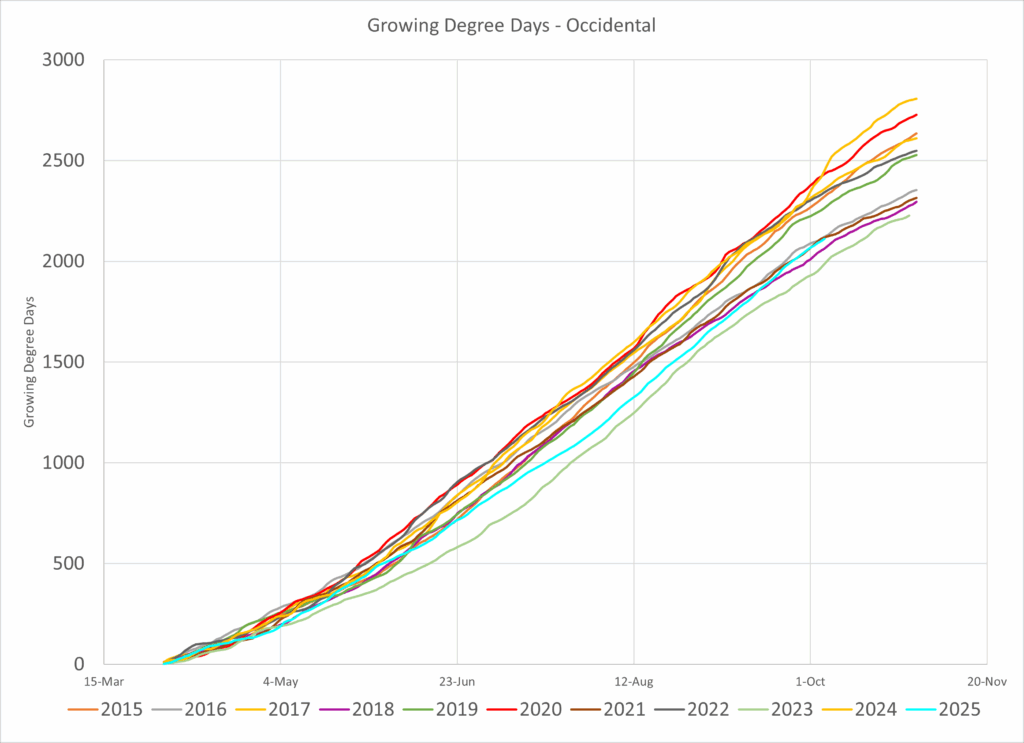
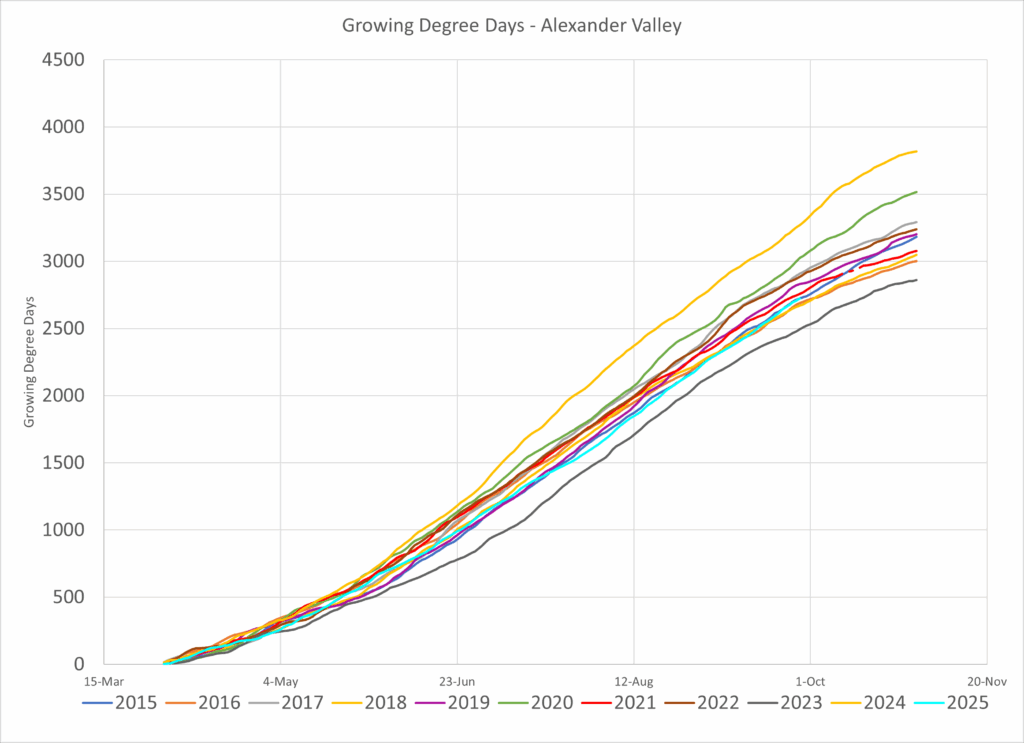
I like looking at how heat accumulates over the course of the season to better understand how one season stacks up against another. The Winkler Growing Degree Day formula allows us to compare different seasons using the same metric. Growing Degree Days (GDD) are calculated by subtracting the grapevines threshold temperature (50°) from the daily mean temperature.
Below are a few graphs from Sonoma County
For the Alexander Valley 2025 (in cyan) comes in just below the previous 11 years except for 2023
Occidental shows a similar situation. 2025 (cyan) was slower to accumulate heat than most years but was warmer during the spring compared to 2023.
Let’s look at how the season played out in Napa.
Calistoga, in the northern part of the valley, saw slowly accumulating heat akin to 2018.
2025 in Saint Helena was right in the middle and seemed to track almost perfectly with 2019.
Oak Knoll, which is typically cooler than other parts of the valley, saw 2025 coming in just above 2023 but with a warmer spring.
2025 in Carneros was right in the middle of the last 7 years.
Let’s look at some places in the Central Coast.
In Templeton, a fairly cool zone with influences from the ocean, 2025 was a much more typical year with respect to 2023 and tracked with 2021.
East Paso also seems to have had an average year as well.
Most notable about these graphs is that the cool spring temperatures that caused a long drawn out bloom period in 2023 was absent. Most growers were able to set some fruit. We didn’t get an early heat wave that got things started just in time to get frosted. That’s nice.
Moderate temperatures, however make for a nasty mildew season. If there’s anything to gripe about…in terms of weather anyway…it was pest pressure. Mildew secondary infection is a function of temperatures and can be charted using the Gubler Thomas mildew model. The image below shows the mildew widget from the AV’s own Avterra portal. Mildew pressure was high throughout the season.
The Avterra data portal tracks mildew risk over time. Risk was high most of the season.
Similar to 2023, what made this year great was the lack of damaging heat waves. This was more noticeable in areas that typically struggle with excessive heat. We did get some warm days, but nothing compared to the hot July of 2024 or the horrendous September of 2022 the latter of which effectively destroyed the vintage for many growers.
The charts below show how summed heat events compare across the last 6 vintages. Here’s the Alexander Valley. While there were a few warm days, there were none above 105°, which is the threshold at which severe damage to vine tissue can occur.
It’s worth noting that these years are considered spectacular in areas where heat events prove year after year to be a big problem. In a place like Carneros, which is typically cooler, a year without heat waves is less anomalous. We didn’t register any days over 100° this year. For other cooler regions such as west Sonoma County and the Templeton Gap in Paso Robles, severe heat events are less of a concern. Unlike 2023, these areas had enough warmth to ripen fruit without having to hang it out until Christmas.
Click image for larger view
Fire on the mountain
Looking at some of the growing degree day accumulation charts, 2025 is looking a little like 2020 but without the devastating Glass Fire that took out most of the vintage in the North Coast. We did get a couple fires that may pose a problem for some parts of California. However, the effect is more localized than in previous years.
Extra innings
While the Pinot and Chardonnay are in the tank, some red growers are still waiting to pull the trigger. 2023 was so markedly cold that some late season varietals didn’t even get ripe. This year however, these grapes are well on their way to ripening and cool weather (with even a little rain!) means less dehydration and less late season shrivel.
Does the innings analogy work? …sports.
In sum
High disease pressure with great wine that no one wants to drink? I feel like I’m back in Europe. For many reasons, this is a vintage to lay down and open up during what we hope will be better times.
All data in this article is from the Western Weather Group.
Let’s look at some maps
Last week I was in the middle of writing a post about how great this year was turning out. I thought, just as long as growers can avoid something disastrous, this could be a great vintage. Within 24 hours, the Pickett fire grew from a small blaze north of Calistoga to a towering wildfire that has since consumed 6000 acres.
Of course, this comes on the heels of the Gifford fire in San Luis Obispo, which has taken out over 100k acres the week before. For some growers in Napa and Edna valley, harvest may be over before it starts. While the definitive kibosh will come from lab analysis, knowing how smokey it got and when is useful for metering expectations and determining the next step.
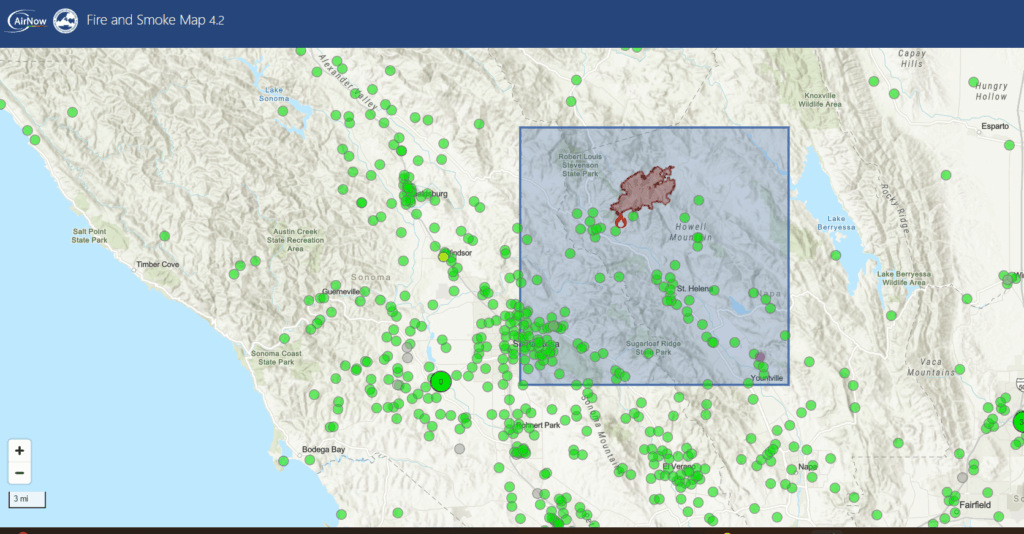
And there are some super useful tools out there! The EPA has a wide network of air quality sensors throughout the country with varying degrees of concentration. The map below shows just how many of these stations are publicly available, so you can see where air quality is suffering the most.
A map of reference AQ stations in the North Coast. The Pickett Fire is outlined in red.
So what is AQI?
The immediate snapshot this resource gives you is the Air Quality Index. This is an index released by the EPA that takes into account several key pollutants:
- Ground level Ozone: primary component of smog
- PM2.5: inhalable fine particles that are 2.5 micrometers in diameter or less.
- PM10: inhalable coarse particles that are 10 micrometers in diameter or less.
- Carbon monoxide: Product of combustion of fossil fuels from vehicles or industry.
- Sulfur dioxide: Reactive gas from combustion of fossil fuels, namely power plants.
- Nitrous dioxide: Another reactive gas from combustion of fossil fuels.
The scale goes from 0 to 500, with anything above 100 considered unhealthy for sensitive groups such as those with asthma. Anything above 150 is classified as unhealthy for everyone.
What we consider when it comes to smoke taint however, is primarily PM2.5, that is, very fine particles. Did your vineyard experience a spike in PM2.5? You are more likely to find smoke taint if you did.
As I write this blogpost at 10pm on a Thursday night, all the dots you see are green, meaning that the AQI is between 0 and 50. Having better AQI at night is pretty typical. We want to know the highs and lows during the day though. Luckily each of these dots gives you hourly and subhourly information on how AQI and PM2.5 have cycled over the last few days.
The EPA also releases this fire-specific information in map form.
They also display information from the Interagency Wildland Fire Air Quality Response Program, which gives information specific to any given fire. Below we have the areas affected by the Pickett Fire in Calistoga, Deer Park, Angwin, and Pope Valley.
The EPA’s website gives you not just air quality but also charts ongoing AQI and PM2.5. The below information is from the reference station in Calistoga. This tracks air quality from the start of the fire onwards.
Air Quality (AQI) from the Calistoga Reference Station
The same station in Calistoga showing concentrations of PM2.5, the pollutant that poses the biggest risk when it comes to smoke taint.
Reference stations are more common in some areas than others. The North Coast has hundreds of these stations available and fewer as you move south. The best way to track your own air quality is by getting your own sensor.
The EPA’s network is largely made up of Purple Air sensors, which are fairly inexpensive and allow you to share your information with the EPA for better monitoring and modeling. These start at just $139.
Alternatively, Davis Instruments offers the Airlink AQ sensor for just north of $200. This provides PM1 (1 micrometer and smaller), PM2.5, and PM10, in addition to AQI. This will display alongside your weather data if you happen to already have a Davis station.
As a caveat, these stations both require Wifi and AC power.
Here's a snapshot of all the information Davis Airlink can give you. This information is available on your phone app and on your weather station dashboard.
As things keep burning here on the West Coast, this is definitely a worthy investment. Otherwise, the publicly available information provides some fun resources to nerd out over as you await your lab results.
Happy picking! Or y’know, not.