

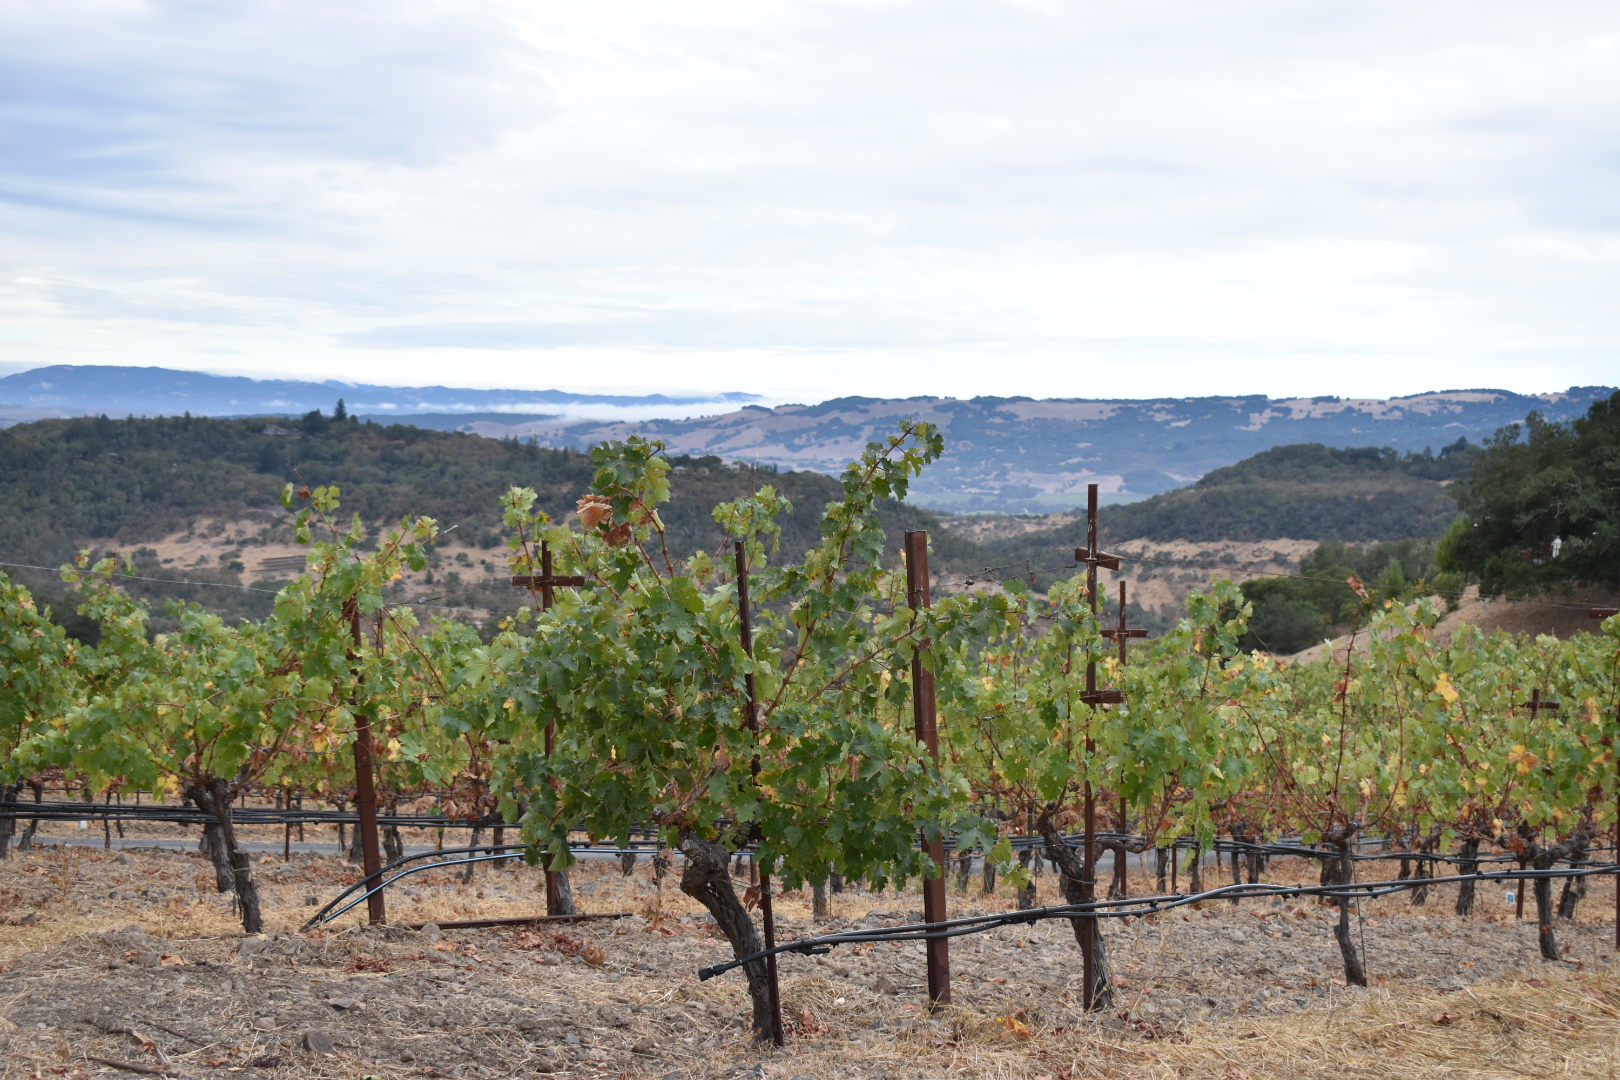
 Most vineyard irrigation decisions in California are made against a stress target. The target might come from a stem water potential program, a canopy assessment, or years of experience with a particular block and a particular wine. Whatever sets it, the question in July is the same. Is the vine where I want it, and did the last set move it.
Soil moisture sensors answer part of that question well. They also get asked to answer a part they cannot.
What the soil profile shows
A soil moisture sensor measures water in the soil immediately around it. Read as a continuous trace rather than a single number, it shows a few things clearly.
Drawdown rate. The slope between irrigation events reflects how quickly water is leaving the profile at that depth. A slope that steepens through June and July is showing the combined effect of vine uptake and rising evaporative demand. A slope that flattens is showing the opposite, and often earlier than a walk through the block would.
Wetting depth. After a set, the order and timing in which sensors at different depths respond shows how far water actually moved. A deep sensor that never responds is telling you that part of the profile is not being recharged. A deep sensor that responds within an hour of every set is telling you something different about how that soil moves water.
Where roots are working. Depths that draw down between irrigations are depths where water is being removed. Depths that hold flat are not contributing much, whatever the root map suggests.
Where soil data stops
Soil water content is not vine water status. Two blocks sitting at the same soil moisture reading can carry different levels of vine stress if canopy size, crop load, rootstock, or the day's evaporative demand differ. Soil water is one input into vine water status, not a substitute for measuring it.
This distinction matters more in wine grapes than in most permanent crops, because the target is frequently a managed level of stress rather than a full profile. The margin between the stress a grower wants and the stress that costs them is narrow, and it moves with the season. The pressure chamber remains the reference for where the vine actually is.
 Using both
Stem water potential readings are direct and infrequent. Soil moisture data is continuous and indirect. They cover each other's weaknesses.
Midday readings anchor the number. Continuous soil data fills the days between readings and shows what each irrigation set did to the profile, so the next decision is not made blind. In practice, the pressure chamber tells you where the vine is, and the soil data tells you what your last decision did and how fast the block is heading back toward the same point.
That second piece is what most growers are missing. A reading on Tuesday and a reading the following Tuesday leave six days unaccounted for, and the sets that ran during those six days are the ones that produced the second reading.
Placement decides what you learn
A sensor in an unrepresentative location produces clean data about a place you are not irrigating for. A few things govern whether a station earns its keep.
Depth. Span the active root zone with at least two depths, and add one below it. The sensor below the root zone is the one that shows water leaving past the vine.
Position relative to the emitter. A sensor inside the wetted pattern and a sensor at its edge answer different questions. Whichever you choose, keep it consistent across stations so blocks can be compared.
Soil variability. On a ranch with three soil types, one station per block tells you less than three stations placed by soil. The unit of placement is the soil and the irrigation set, not the property line.
Continuity. Stations left in place season over season allow year-to-year comparison. Stations moved every spring produce a series of unrelated data sets.
What continuous monitoring adds
Beyond interpretation, a continuous record catches things that spot readings structurally cannot:
Sets that ended before water reached the depth intended
Water moving below the root zone, which is applied water leaving the system
A set that registered no soil response at all, which usually points to pressure, flow, or a valve rather than to the soil
Two blocks on the same schedule behaving differently, which is generally the first sign that one of them should not be on that schedule
None of these require a threshold or a prescription to be useful. They are simply the difference between knowing what was scheduled and knowing what happened.
The record itself
Applied water records paired with soil response are increasingly worth keeping for reasons beyond agronomy. Groundwater sustainability agencies operating under SGMA are asking growers to report use. CDFA SWEEP applications ask for baseline and post-project data. Sustainability certification programs ask for documentation of irrigation management practice. A system that logs applied water and soil response continuously produces that record as a byproduct of daily operation rather than as a reconstruction at the end of the season.
What does not change
Sensors have gotten cheaper, easier to install, and easier to read every year for the past decade. The interpretive work has not changed at all. It still comes down to knowing what the sensor sees, knowing what it does not, and being clear about which of those two questions you are asking it.
WiseConn builds irrigation monitoring and control systems used in vineyards and permanent crops across California, Washington, Chile, and Australia. The DropControl platform brings soil moisture, flow, pressure, and valve control into one water management system.